Have you ever wondered how online stores seem to know exactly what you want to buy? Or how they manage to show you products you’re likely interested in? The secret lies in a field called predictive analytics, which is basically using past data to make educated guesses about the future.
In this blog post, I’ll walk you through a real-world example of how data science helps an online store understand its customers better. Don’t worry if you’re new to this – I’ll break everything down into simple terms!
The Business Problem: An Online Store in Trouble
Imagine an online store that’s facing some serious problems:
- Their website keeps crashing randomly
- Customers are getting frustrated with service interruptions
- They’re spending a lot of money fixing unexpected issues
The company wants to use data to solve these problems. Specifically, they want to understand what makes customers buy products on their website, so they can improve the customer experience and reduce technical problems.
The Data: Digital Footprints
The company has collected information about 12,330 visits to their website. For each visit, they recorded things like:
- How many pages each visitor looked at
- How much time they spent on different types of pages
- Whether they came from Google, social media, or directly typed the website address
- Whether they were a new or returning visitor
- Whether they ended up buying something (this is what we want to predict!)
This data is like digital footprints that customers leave behind as they browse the website.
Exploring the Data: Looking for Patterns
Before jumping into complicated algorithms, I first wanted to understand what the data actually tells us. Here are some interesting things I discovered:
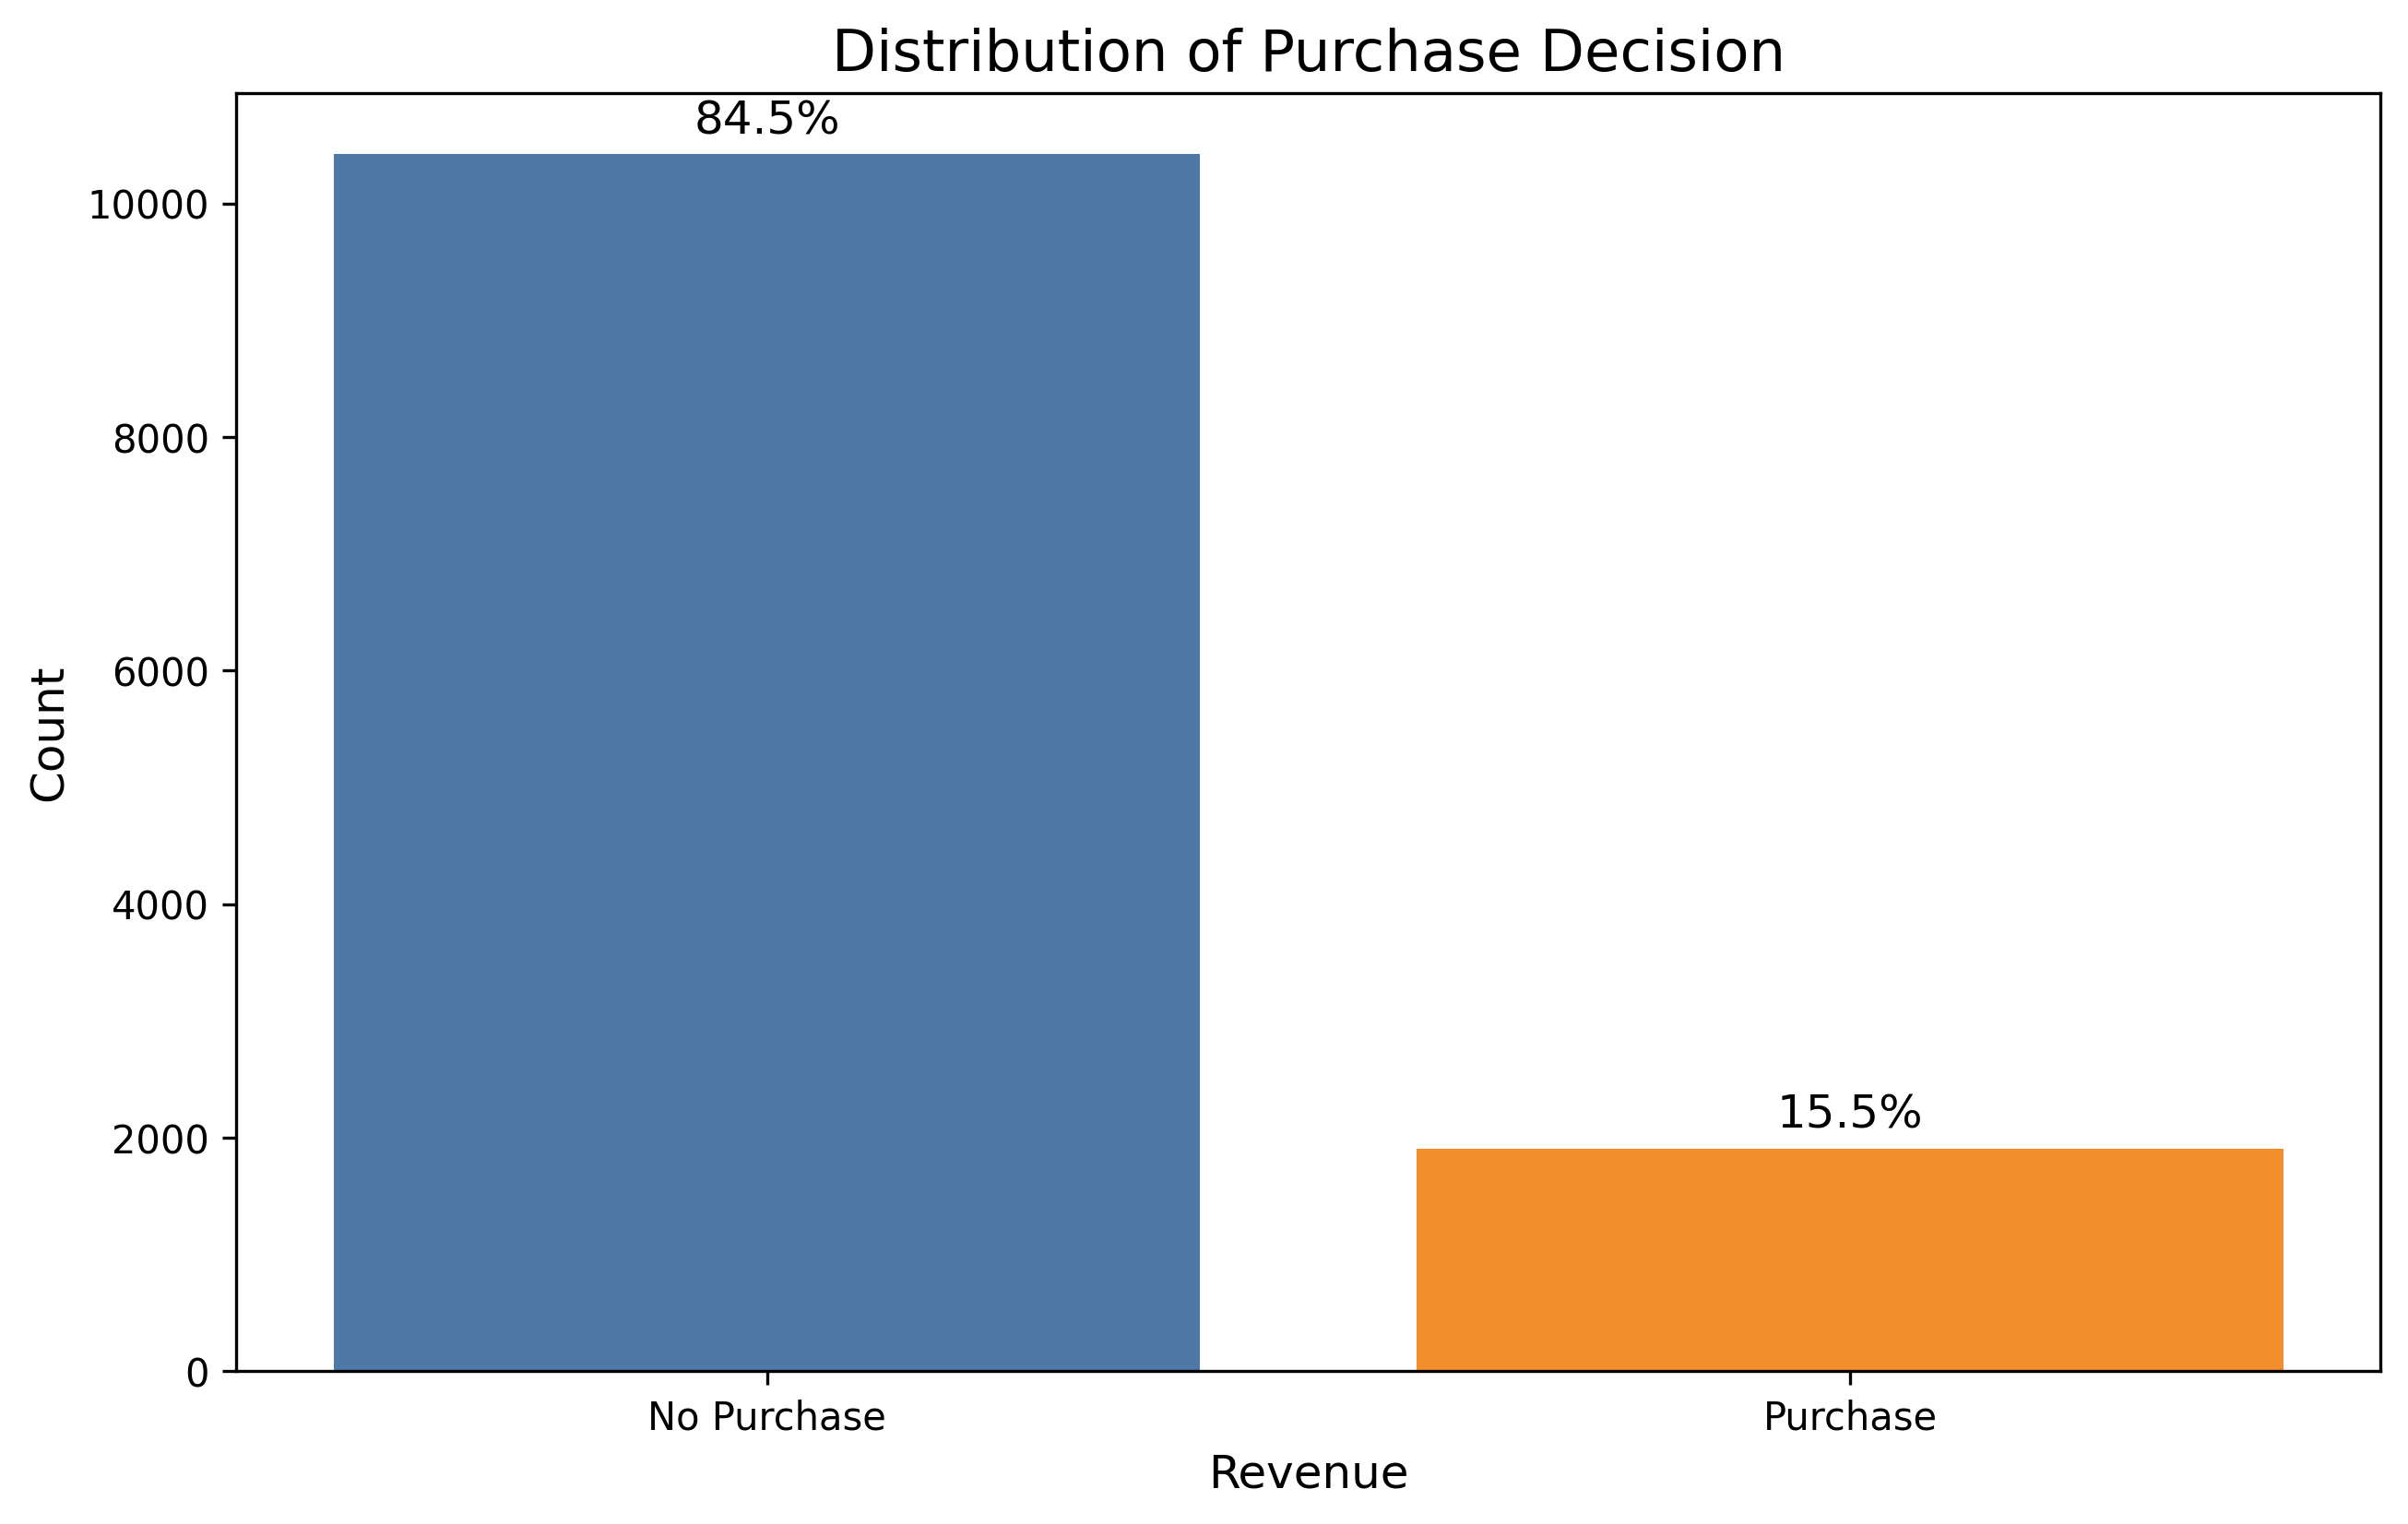
- Only about 15% of visitors actually make a purchase. This is normal for e-commerce but means we need to be careful about how we evaluate our predictions.
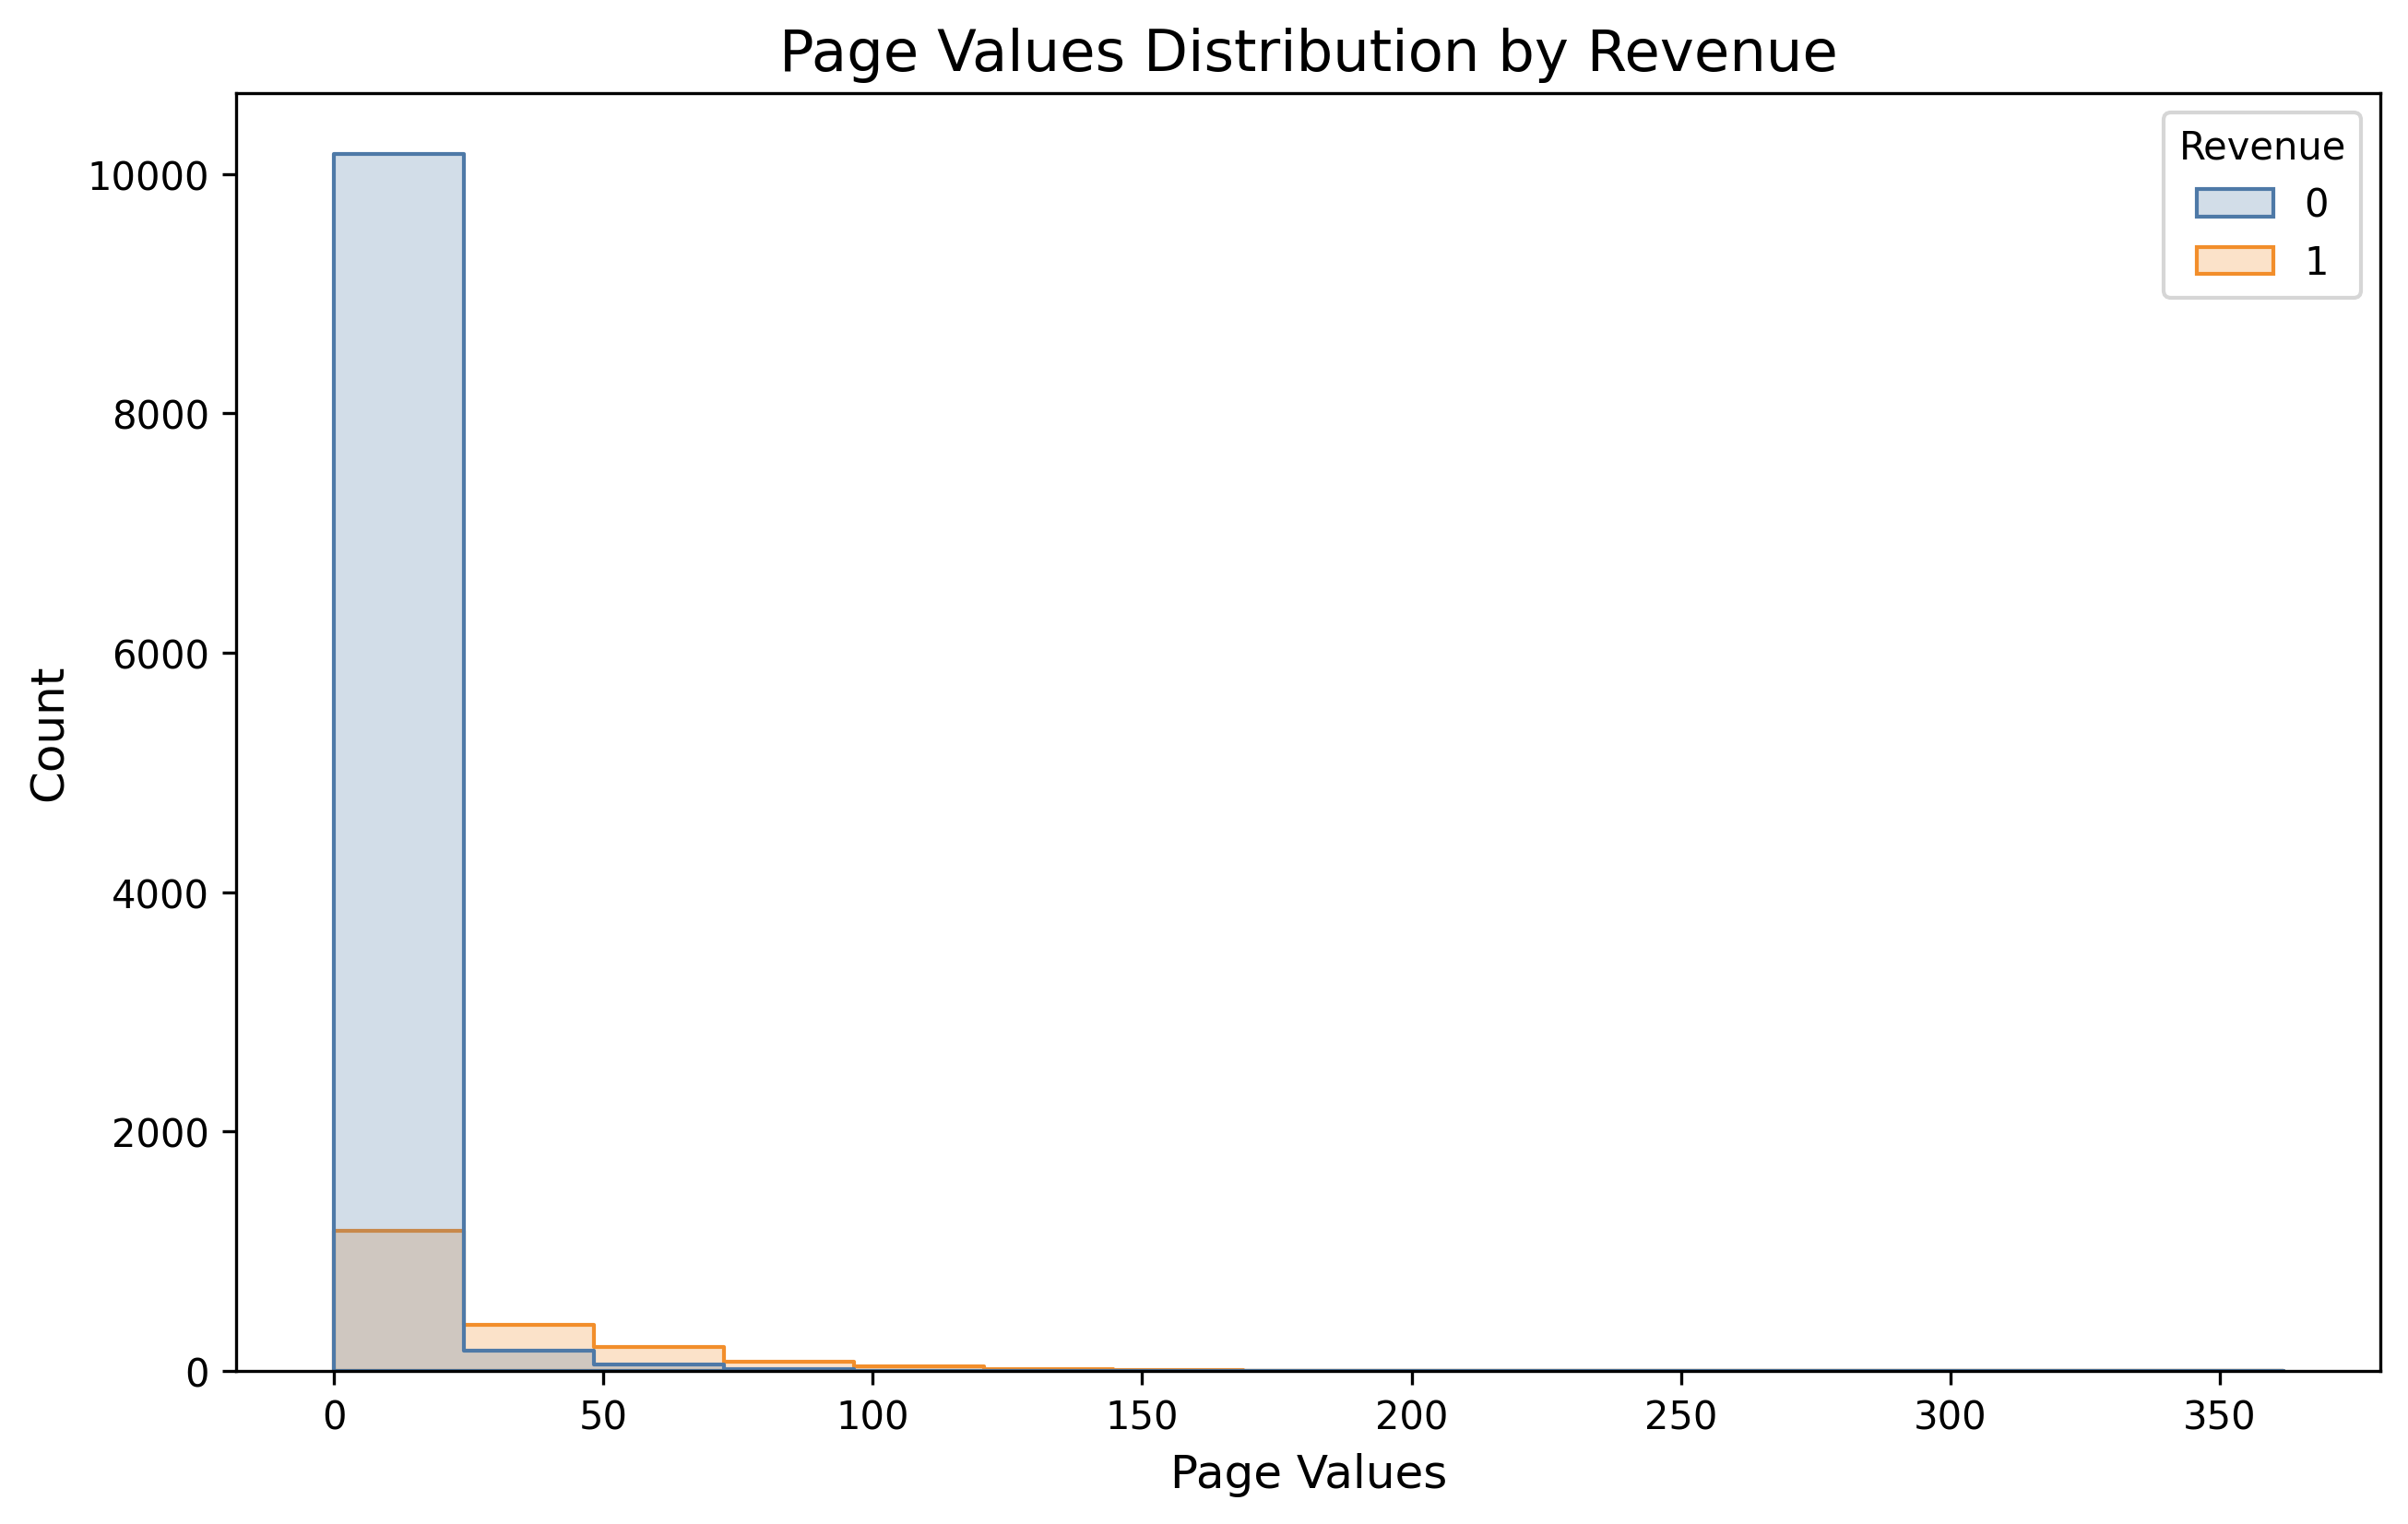
- There’s a strong relationship between something called “Page Value” and whether someone makes a purchase. Page Value is essentially how valuable a page is in leading to a purchase.
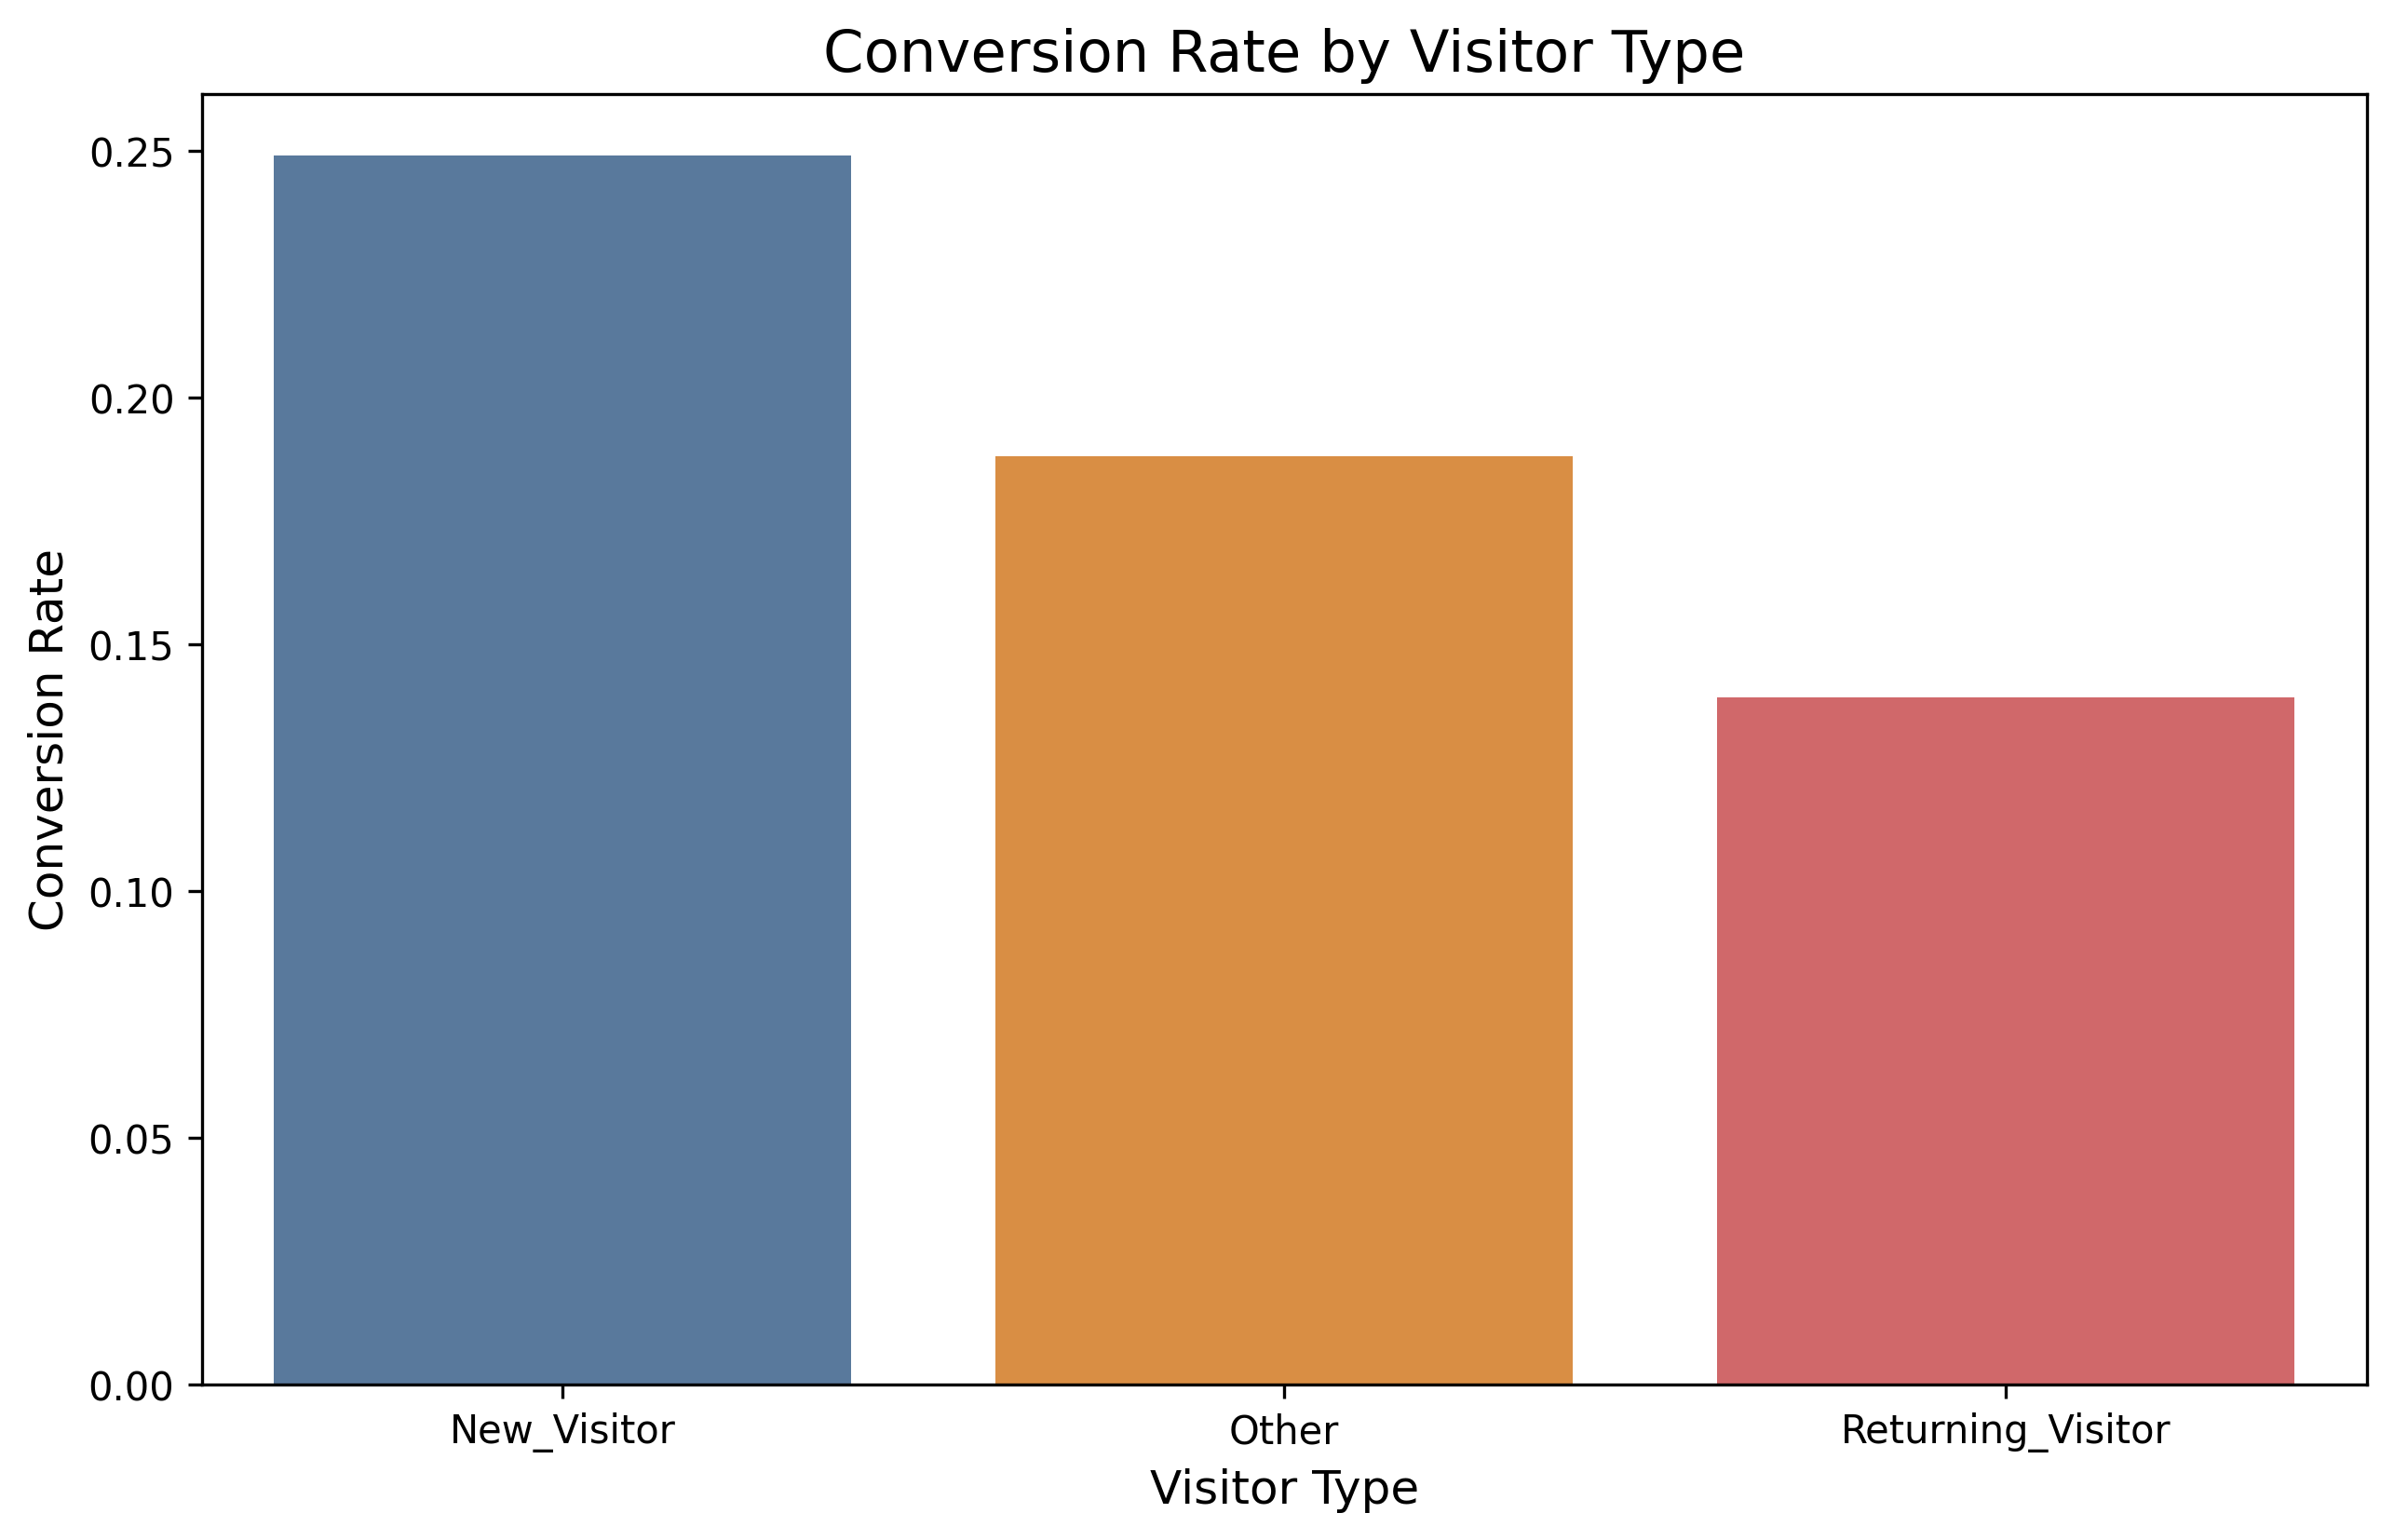
- Returning visitors are more likely to make purchases than new visitors. This makes sense people who come back probably already trust the site.
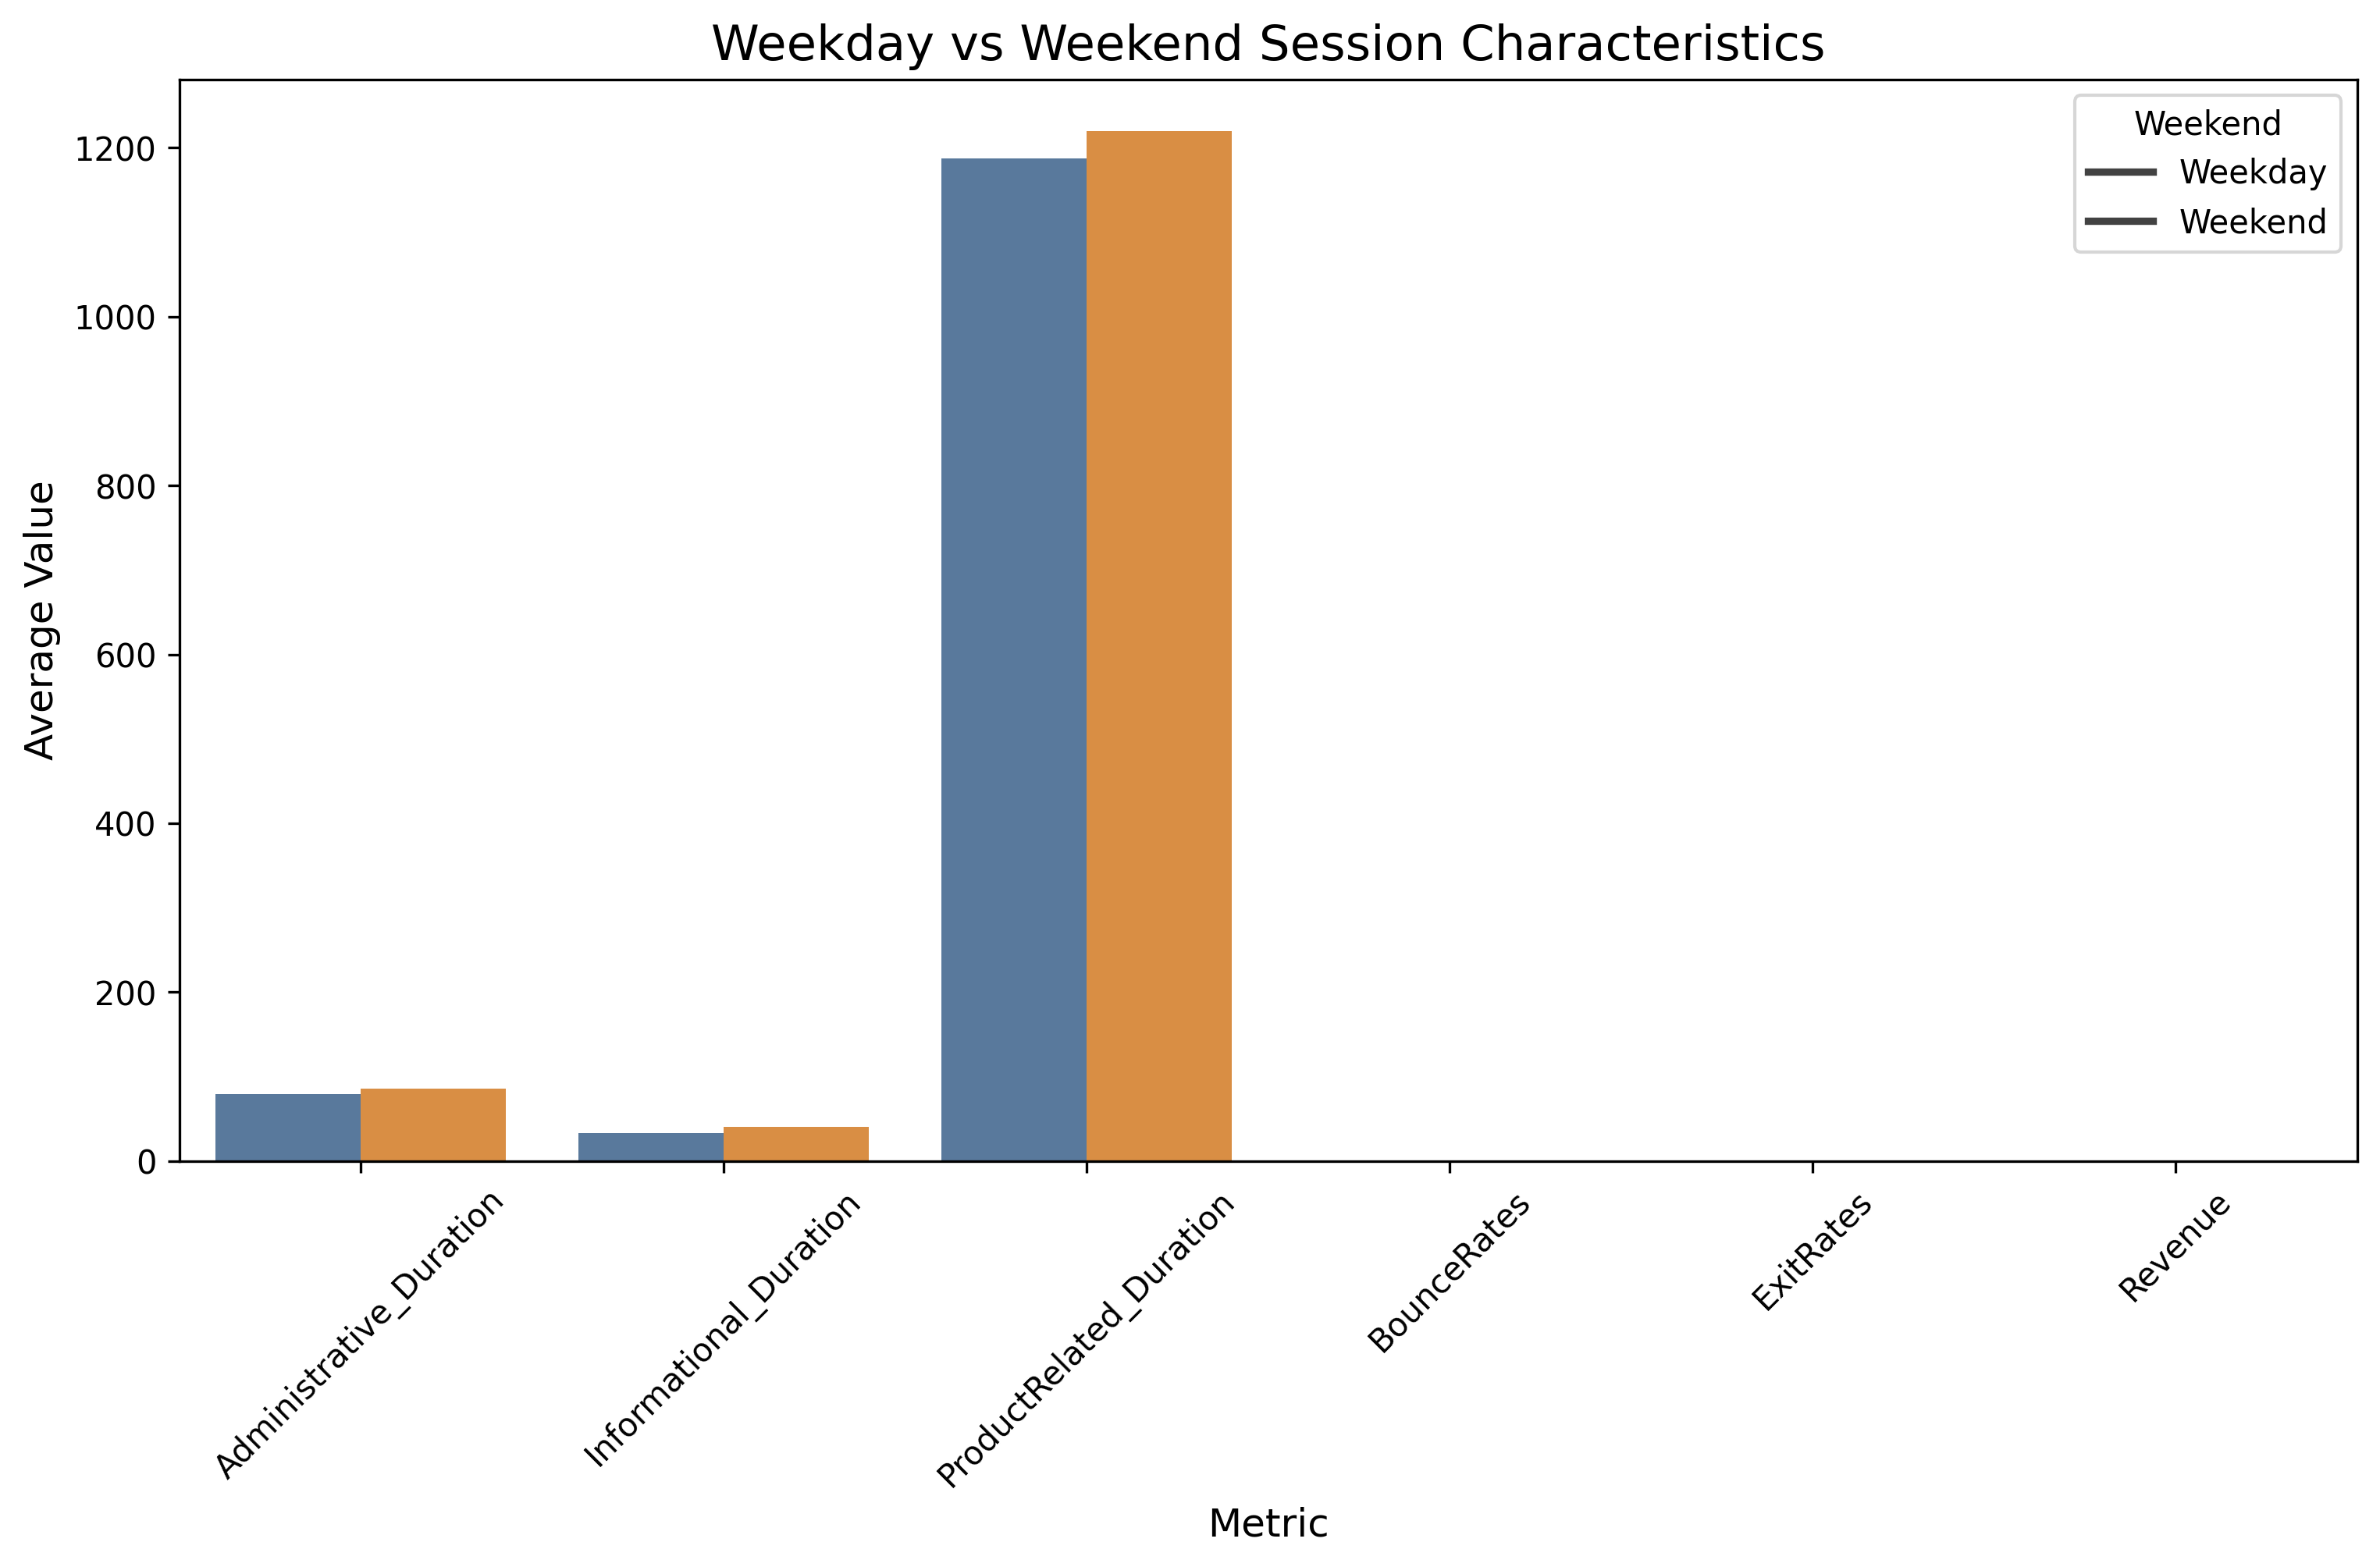
- Weekend shoppers behave differently than weekday shoppers.
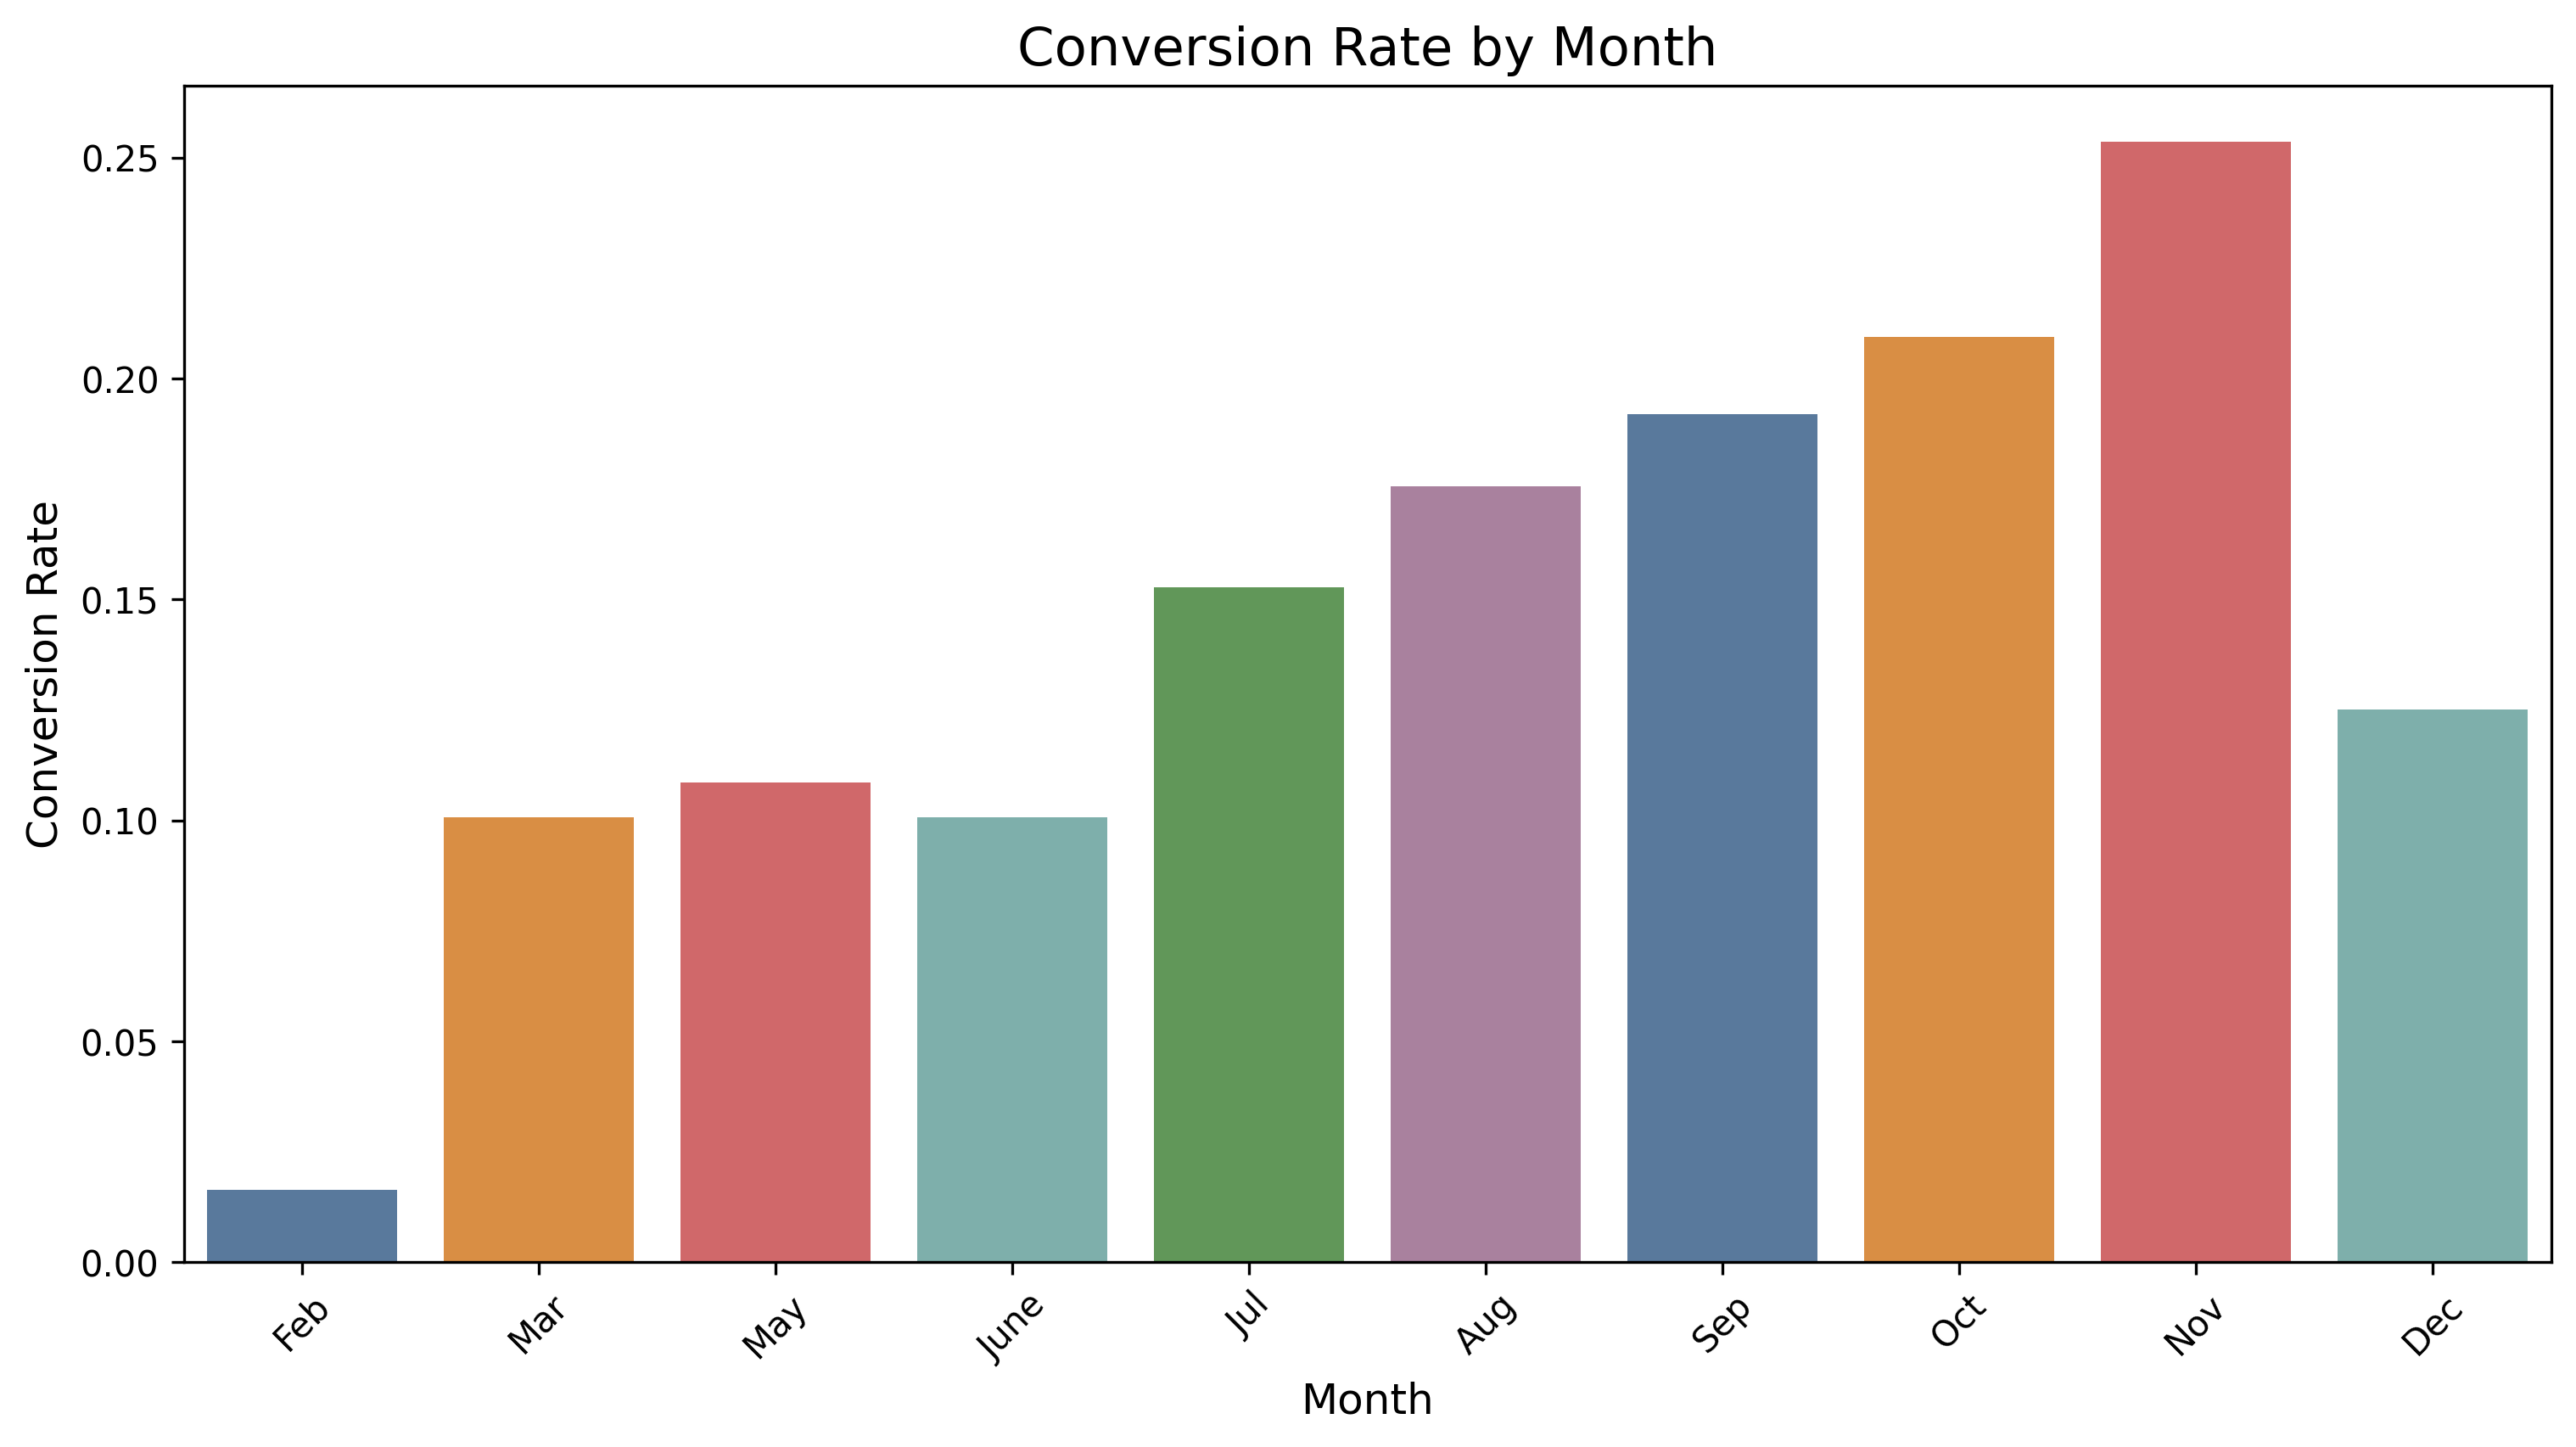
- Some months have higher purchase rates than others – November and December show higher conversion rates, likely due to holiday shopping.
These initial findings already give us valuable insights for the business!
Building Predictive Models: Teaching Computers to Make Guesses
Now comes the fun part – creating models that can predict whether a visitor will make a purchase. I tried four different approaches:
- Logistic Regression: A simple approach that’s easy to understand
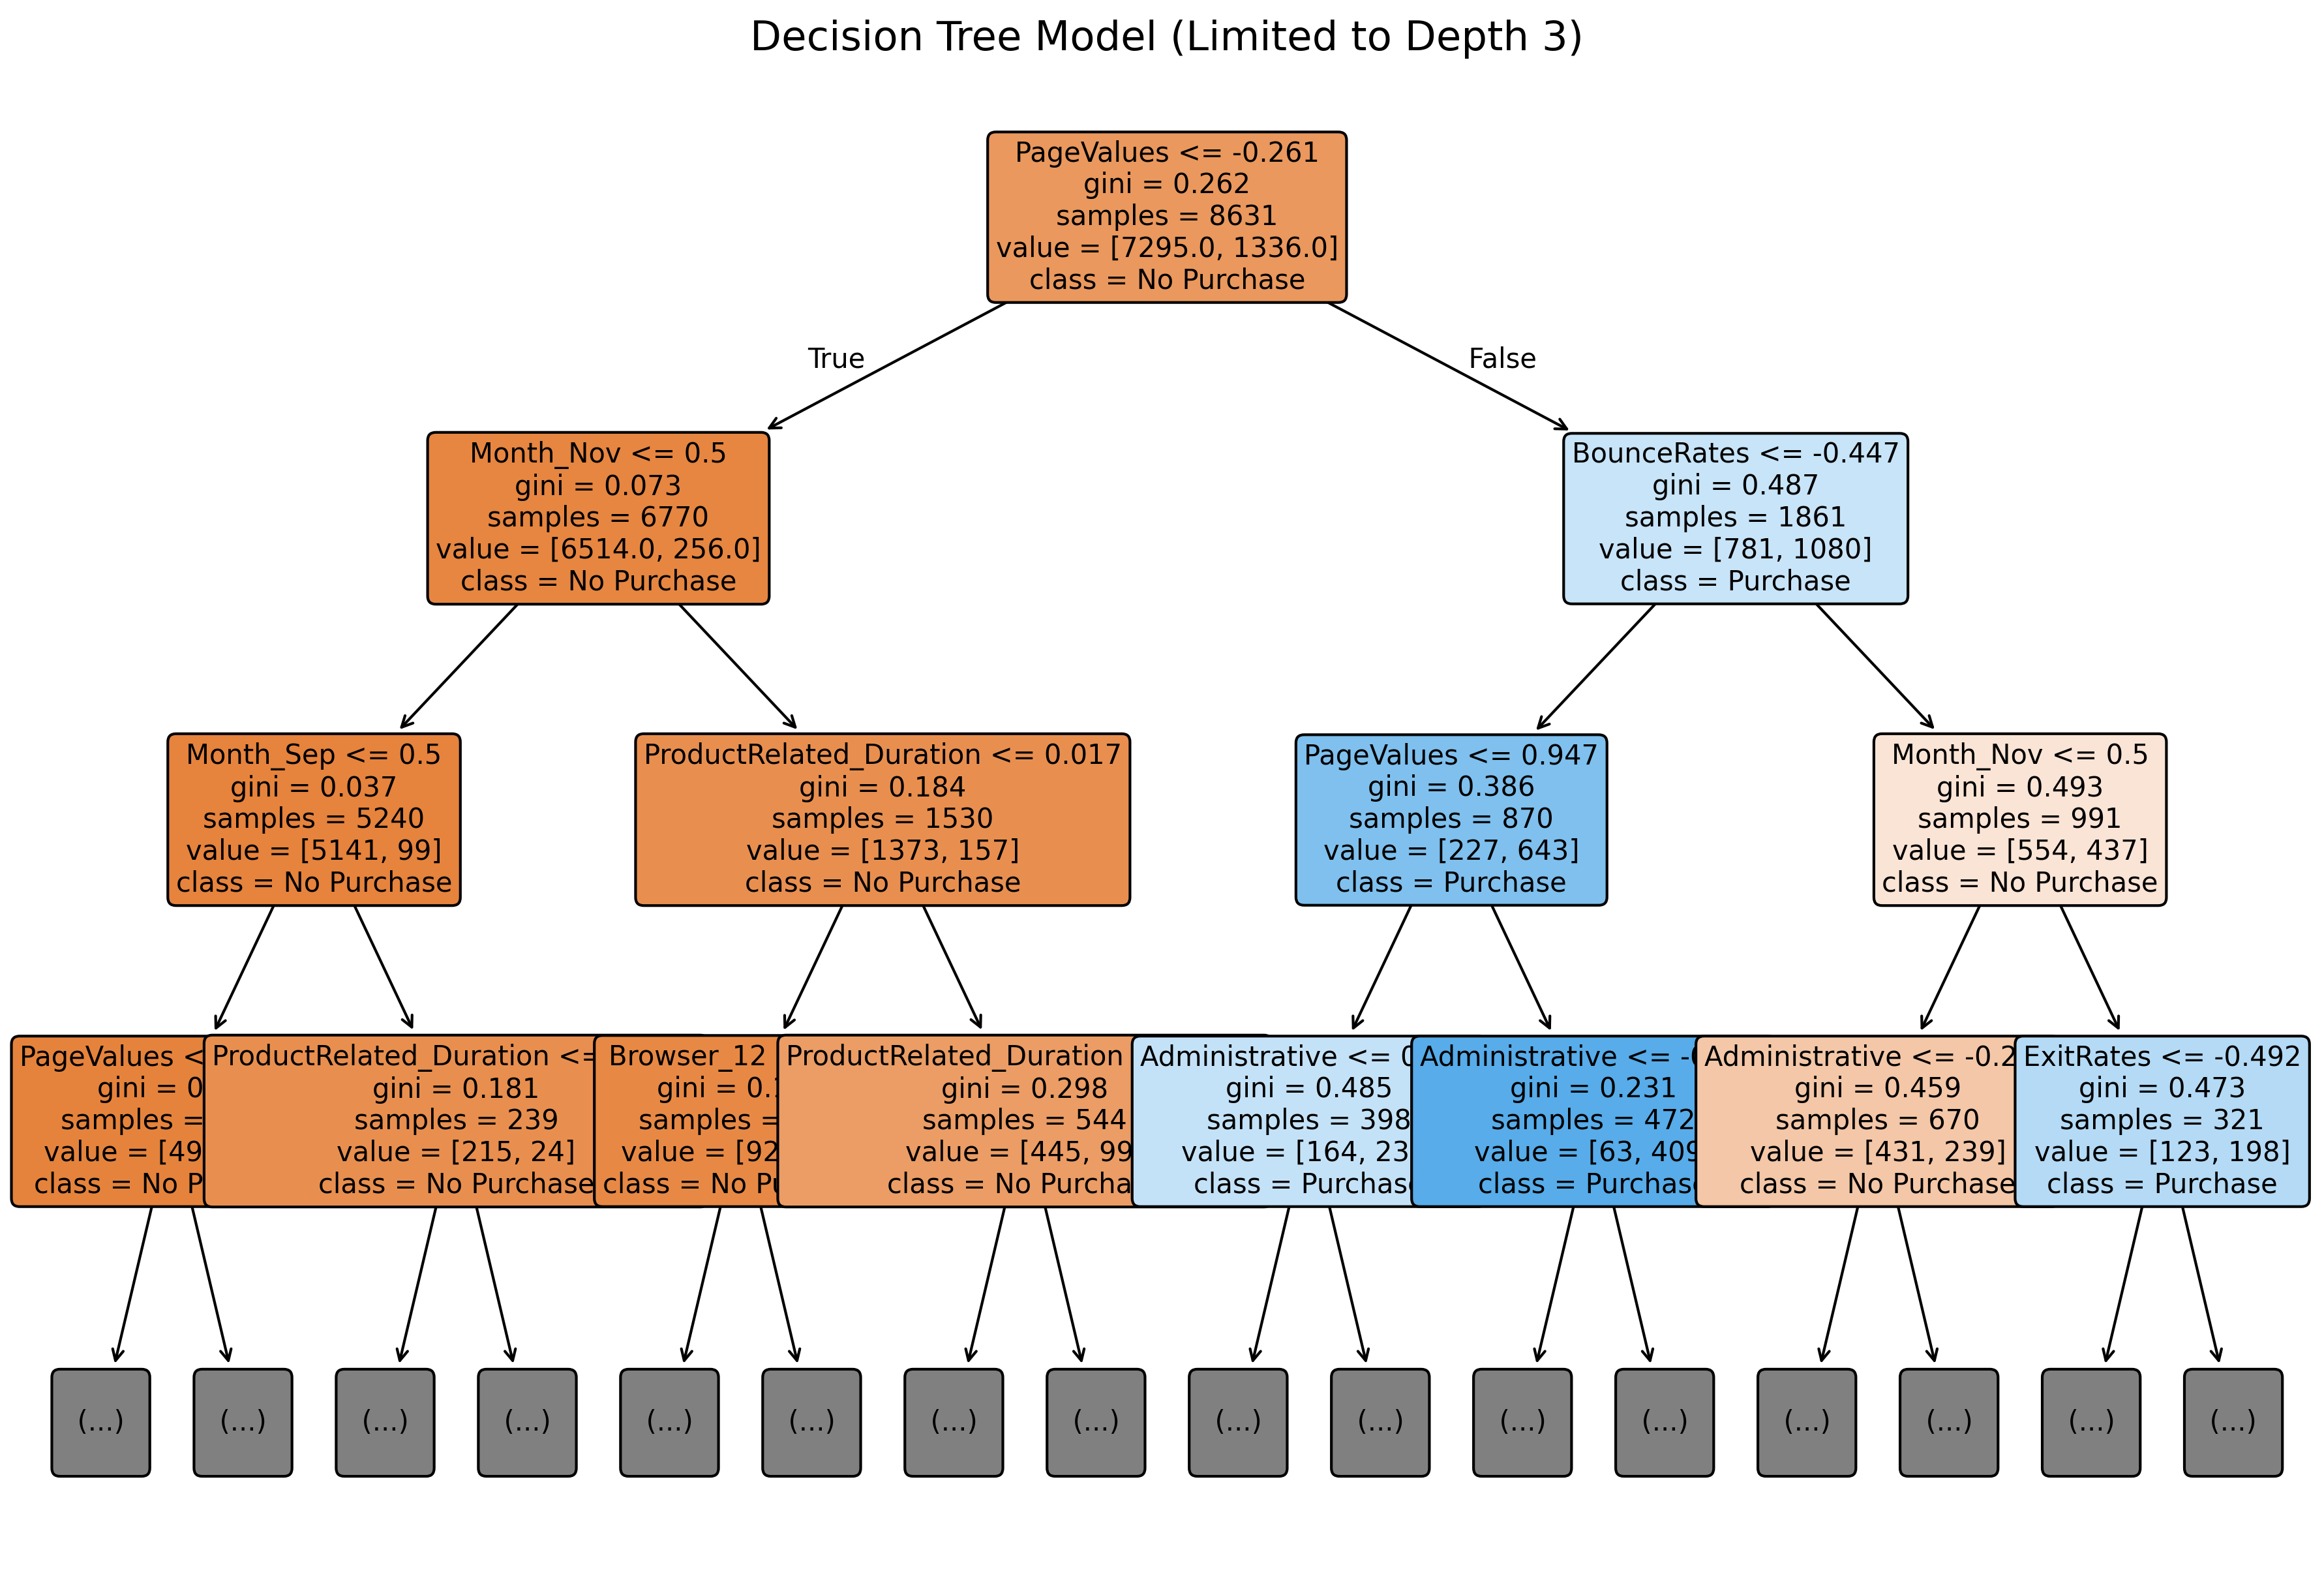
- Decision Tree: Think of this as a flowchart of yes/no questions
- Random Forest: Imagine combining hundreds of decision trees and letting them vote
- XGBoost: A more advanced technique that often performs very well
For each model, I followed these steps:
Split the data: I used 70% of the data to train the models and kept 30% separate to test how well they perform.
Prepare the data: Computers don’t understand things like “returning visitor” or “weekday” directly, so I converted these categories into numbers they can work with.
Train the models: This is where the computer learns patterns from the data.
Fine-tune the models: I tested different settings for each model to find what works best (this is called hyperparameter tuning).
Evaluate performance: I checked how accurately each model could predict purchases.
Results: Which Model Worked Best?
After training all four models, I compared their performance:
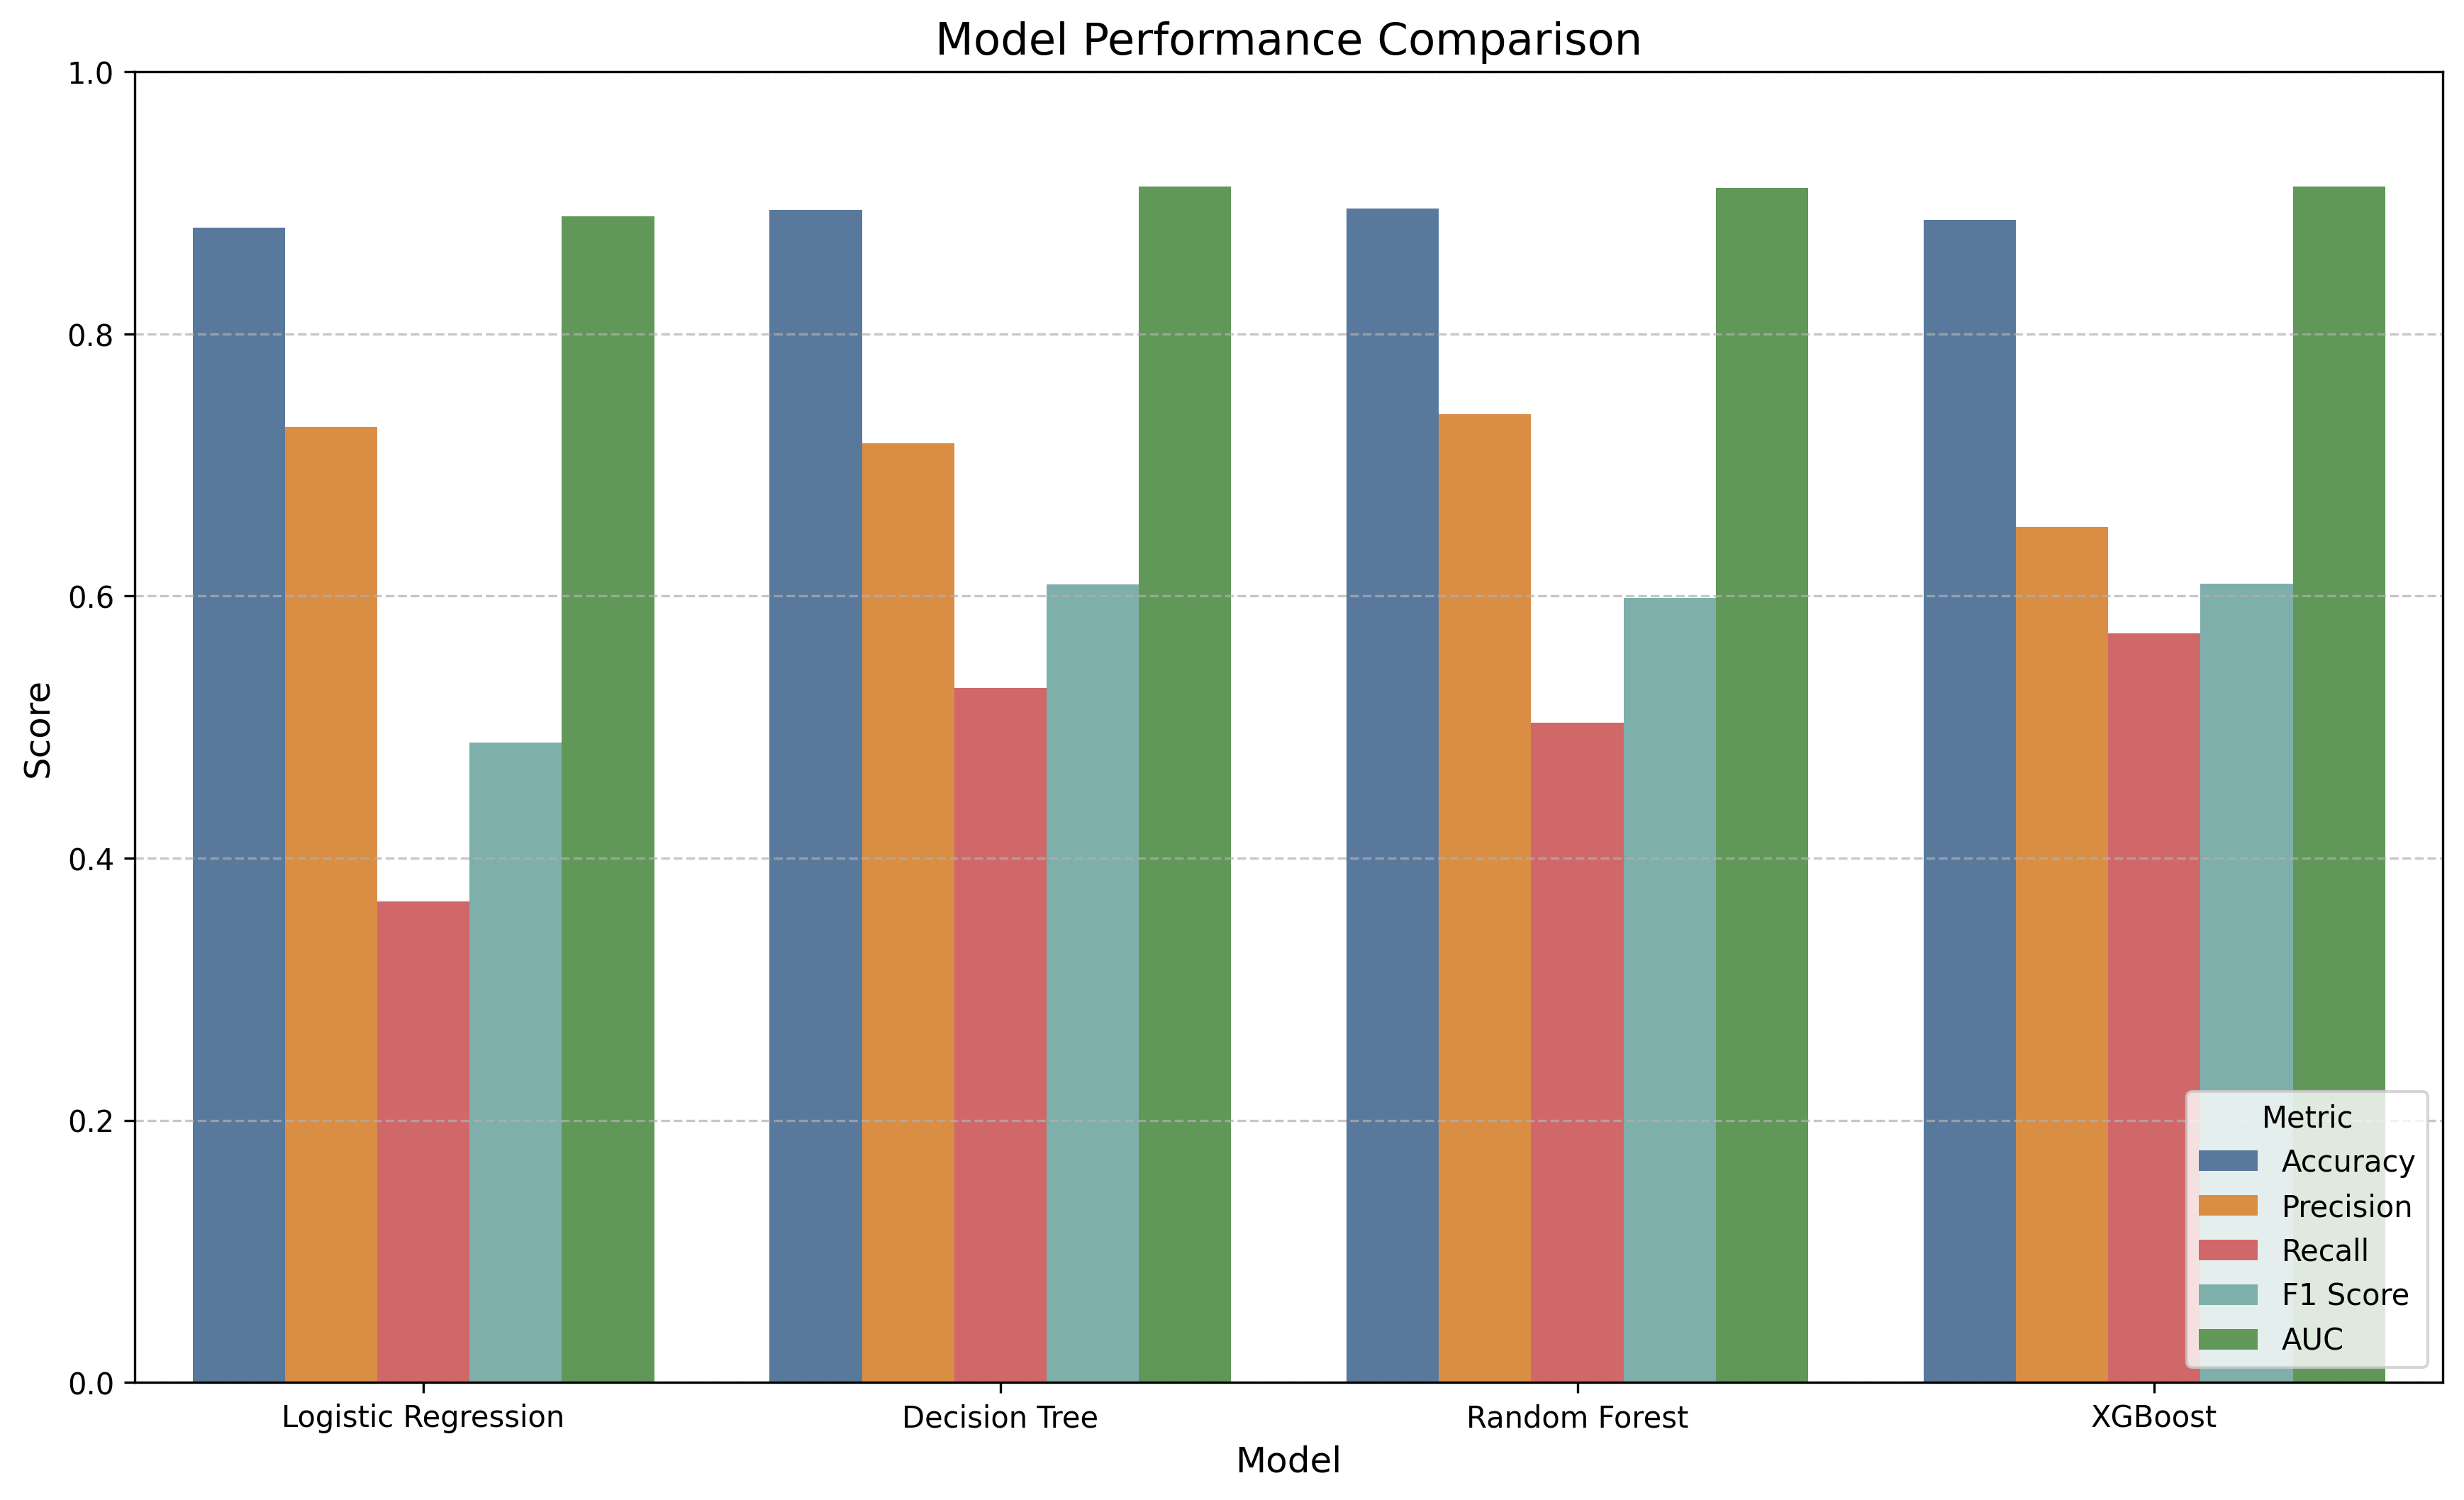
The Random Forest model performed best, correctly predicting purchases about 90.5% of the time. More importantly, it achieved what’s called an AUC score of 0.94, which is excellent! (AUC measures how well the model distinguishes between customers who will purchase and those who won’t.)
I also looked at what factors were most important for predicting purchases:
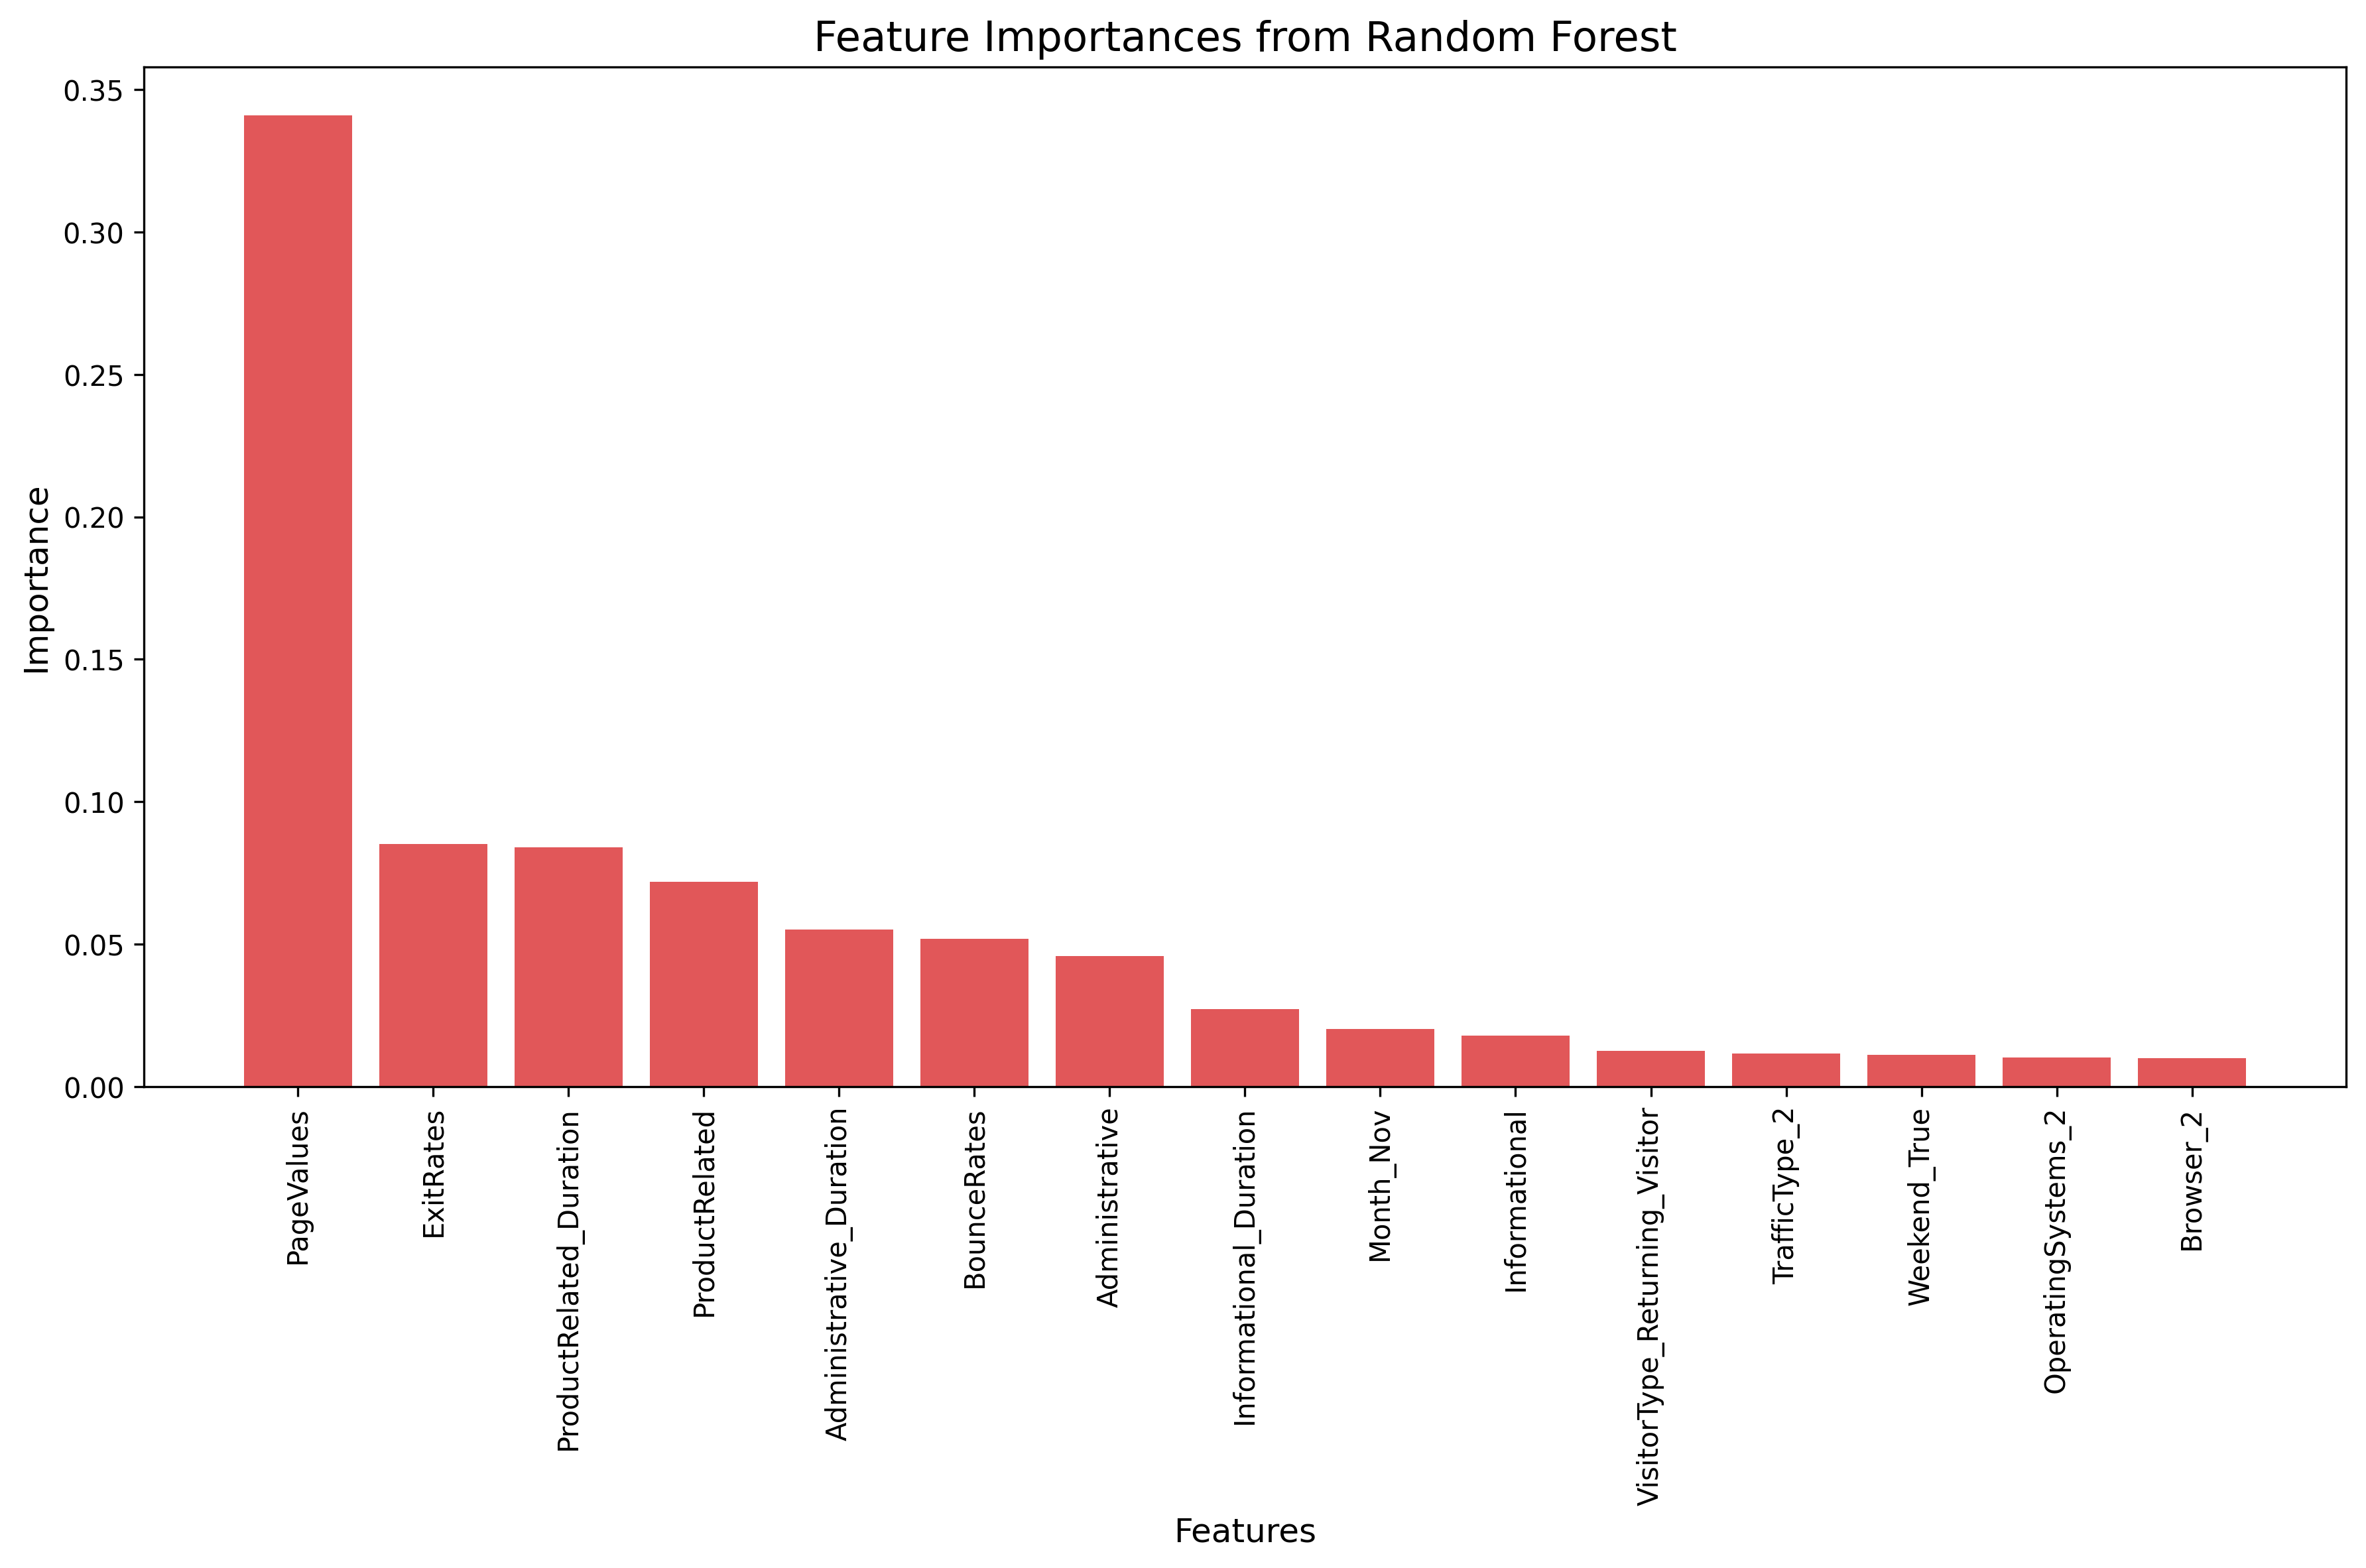
The top predictors were:
- Page Value (how valuable pages visited are toward conversion)
- Exit Rate (percentage of visitors who leave from specific pages)
- Time spent looking at product pages
- Bounce Rate (people who leave immediately)
- Time spent on administrative pages (like account settings, shipping info)
Making Business Sense of the Results
So what does all this mean for our struggling e-commerce company? Here’s what they should do:
Focus on product pages: Since time spent on product pages strongly influences purchases, they should make these pages load faster, look better, and contain more useful information.
Pay attention to high-exit pages: Pages with high exit rates might have usability problems that need fixing.
Create a real-time prediction system: They could use our model to identify visitors who are likely to make a purchase and offer them special deals or better customer service.
Develop targeted marketing: Different strategies should be used for returning visitors versus new visitors.
Monitor for technical problems: Pages with unusually high bounce rates might indicate technical problems that need fixing.
Technical Details Made Simple: How the Models Actually Work
If you’re curious about how these models actually make predictions, here’s a simplified explanation:
Logistic Regression looks at all the factors (like time on site, visitor type, etc.) and assigns weights to each one. It then combines these weighted factors to calculate the probability of a purchase.
Decision Trees work by asking a series of yes/no questions. For example: “Is the Page Value greater than 10?” → “Did they visit more than 5 product pages?” → and so on.
Random Forest builds hundreds of different decision trees and lets them vote on the final prediction. This is more powerful because it combines many perspectives.
XGBoost builds trees one after another, with each new tree focusing on fixing the mistakes made by previous trees.
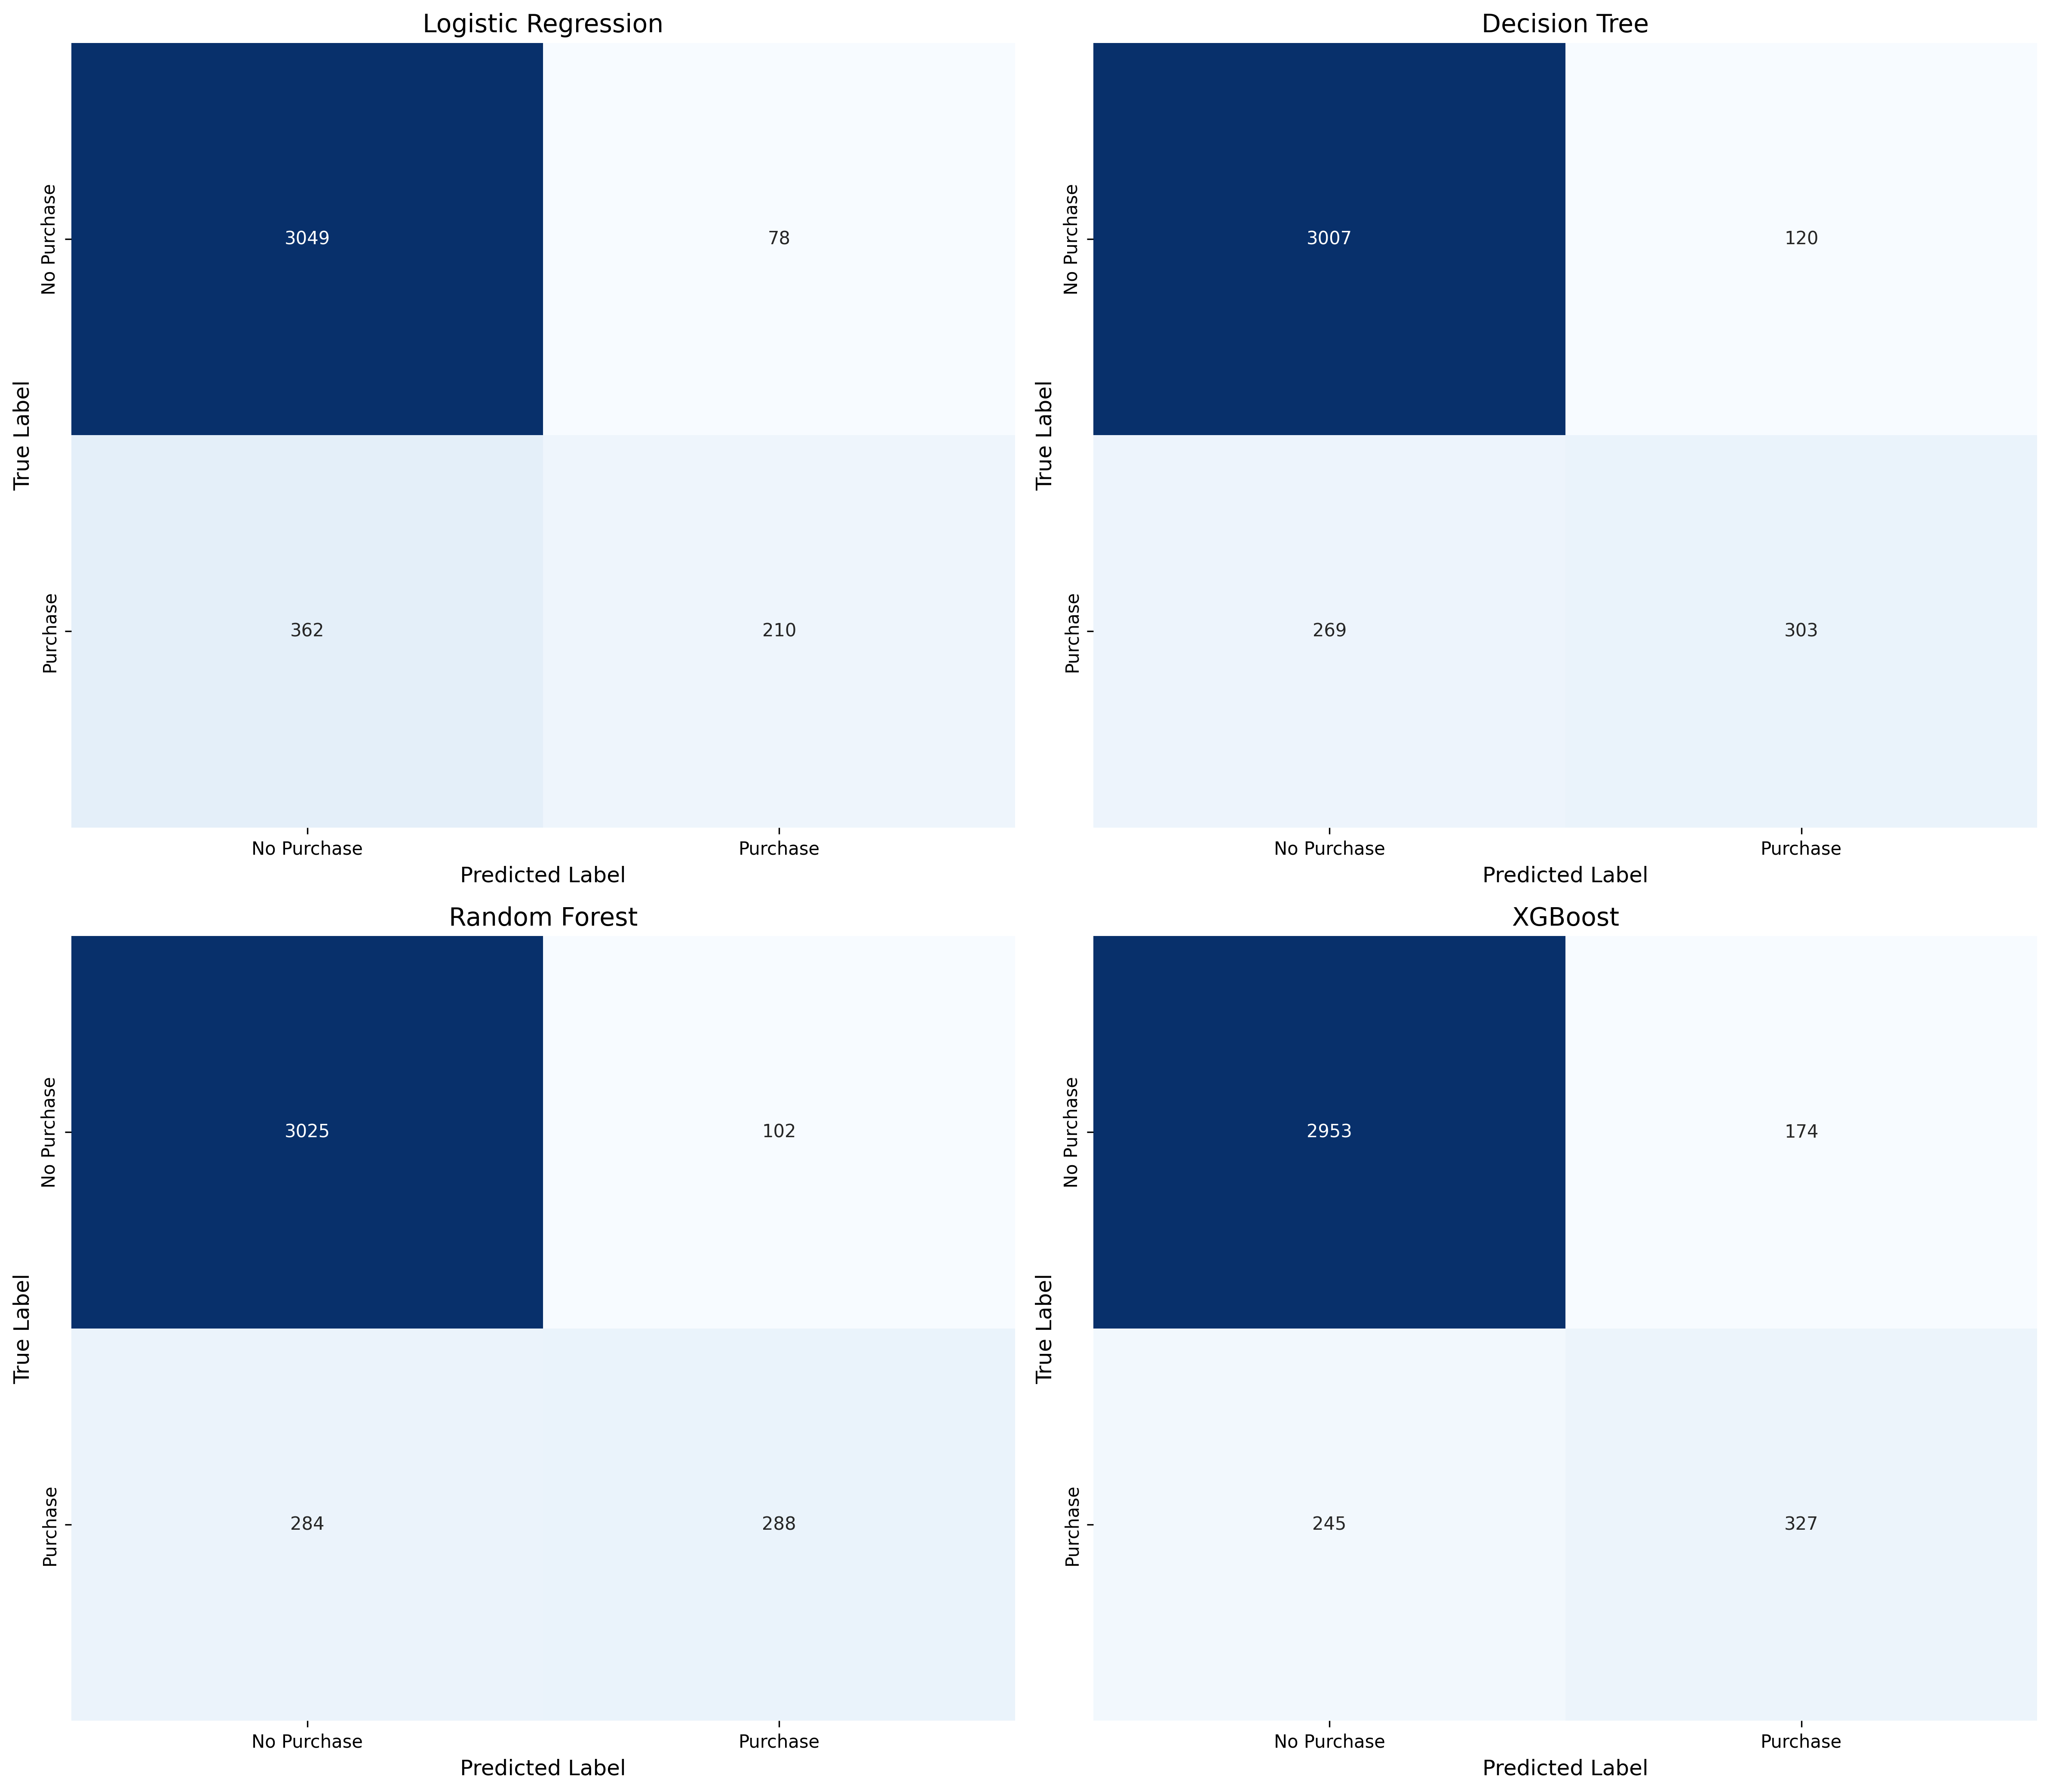
All models were evaluated on multiple metrics. One helpful visualization is the “Confusion Matrix” which shows correct and incorrect predictions:
Why This Matters (Even If You’re Not a Data Scientist)
Even if you never build a predictive model yourself, understanding this process helps you:
- Appreciate the power of data in making business decisions
- Ask the right questions when someone presents data-driven recommendations
- Understand the limitations of predictive models (they’re powerful but not perfect)
The next time you’re shopping online and see a “Recommended for you” section, you’ll have a better idea of the complex analytics happening behind the scenes!
References
https://medium.com/analytics-vidhya/predictive-web-analytics-a-case-study-f30feda45002
https://archive.ics.uci.edu/dataset/468/online+shoppers+purchasing+intention+dataset